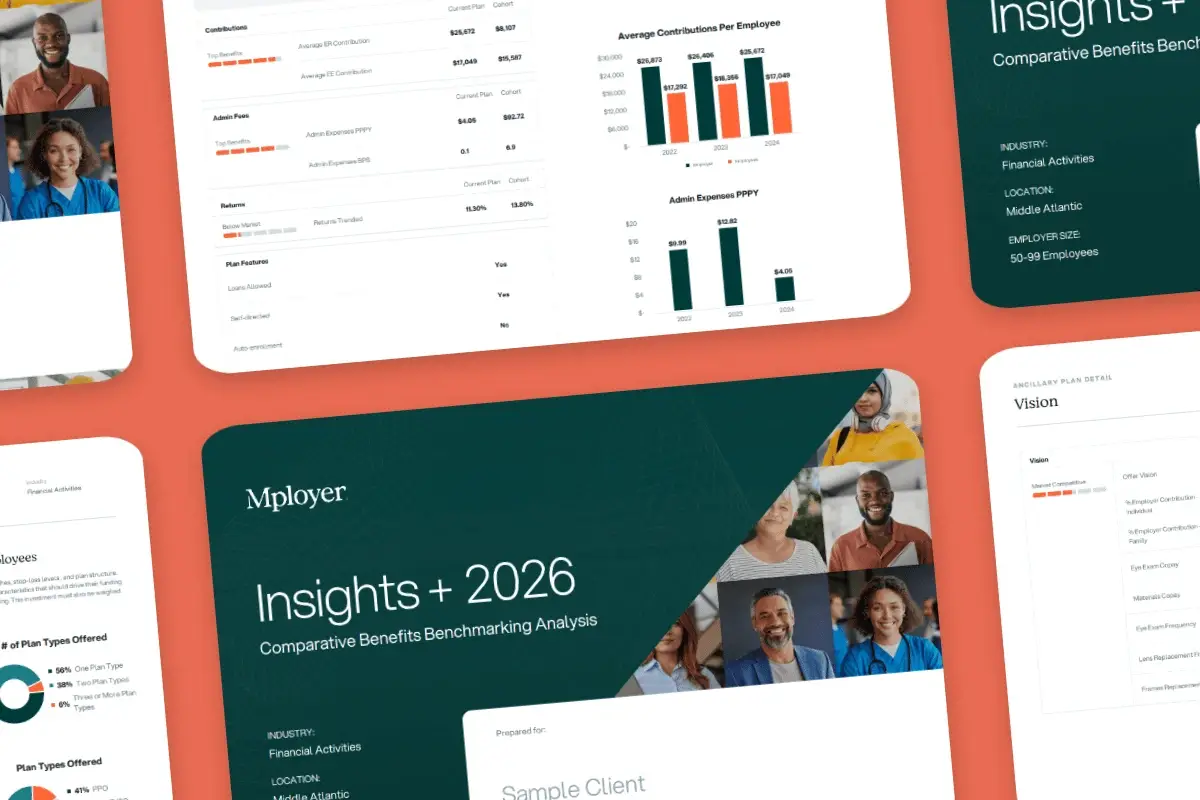
Most small businesses are guessing when it comes to employee benefits. Learn what benefits benchmarking is, why it matters for talent retention, and how to get a free customized benchmarking report for your business.
The Benefits Guessing Game
Ask most small business owners whether their employee benefits are competitive and you’ll get one of two answers: a vague “I think so” or an honest shrug. Very few have data to back it up.
That’s not a knock on those business owners. It’s just the reality of running an SMB. You’re not staffed with a team of benefits analysts. You’re not subscribing to expensive HR consulting services that deliver peer comparison reports. You set up a health plan when you hired your first employees, maybe added dental and vision along the way, and have been rolling it forward at renewal time ever since.
The problem is that your employees, and the candidates you’re trying to hire, are doing their own comparisons. They know what the company down the street offers. They talk to friends. They read job listings. And if your benefits package doesn’t stack up, you may be losing good people without ever knowing why.
What Is Employee Benefits Benchmarking?
Employee benefits benchmarking is the process of comparing your company’s benefits offerings against data from peer companies: businesses that are similar to yours in industry, company size, and geography. The goal is to understand how your benefits stack up on the dimensions that matter most to employees: health insurance plan design, what percentage of premiums you cover, dental and vision options, PTO policies, retirement contributions, and more.
Done well, benchmarking answers the question every business owner should be asking: “Are we offering enough to compete for and retain the people we need?”
For years, this kind of analysis was only accessible to large enterprises with dedicated HR teams or the budget to hire benefits consultants. Small businesses were left making decisions based on gut instinct, broker suggestions, or whatever was easiest to administer at renewal time. That gap is closing, but only for business owners who know where to look.
Why Benefits Benchmarking Matters More Than You Think
The stakes are higher than they’ve ever been. Candidates today evaluate total compensation, not just salary, before accepting job offers. And benefits represent a significant component of that total package. According to the Society for Human Resource Management (SHRM), benefits are among the top factors employees consider when evaluating whether to stay with an employer or look elsewhere.
For small businesses, this creates a structural disadvantage, or at least it appears to. Without group buying power, small companies typically can’t access the same plan quality or premium rates as large employers. That means a 15-person company competing against a 500-person company for the same candidate is potentially offering a noticeably inferior benefits package.
But here’s what benchmarking reveals that most small business owners don’t realize: you’re not always competing against large employers. You’re competing against other companies your size, in your industry, in your region. And in that peer group, the differences often come down not to plan quality but to employer contribution strategy: how much of the premium you’re covering. That’s a lever most small businesses can actually adjust.
What a Good Benefits Benchmark Actually Measures
Not all benchmarking is created equal. A meaningful benchmark report needs to do more than show you national averages; it needs to be filtered to your specific situation. Here’s what a rigorous analysis covers:
Medical Plan Design & Employer Contributions
This is the core of most benefits packages and the dimension with the most variation. A good benchmark will show you the prevalence of plan types (HMO, PPO, HDHP), deductible ranges, and, critically, what percentage of the employee and dependent premium employers in your peer group are covering. The contribution percentage is often the most actionable data point.
Dental & Vision Coverage
Dental and vision are increasingly expected, not optional. Benchmarking shows the prevalence of these benefits in your peer group and the employer contribution norms, helping you understand whether offering these plans is simply table stakes or an actual differentiator.
Leave & PTO Policies
Paid time off has become a major factor in employee satisfaction and retention. How many vacation days, sick days, and paid holidays are companies your size offering? Are they offering paid parental leave? Flexible or unlimited PTO? This section of a benchmark report surfaces what the market standard actually looks like, which may surprise you.
Retirement Benefits
401(k) plan prevalence and employer match rates vary significantly by company size and industry. Many small businesses skip retirement benefits entirely, not realizing how common they are in their peer group, and how much weight candidates give them. Benchmarking shows you the match prevalence, contribution rates, and vesting norms in your cohort.
Overall Benefits Rating
A comprehensive report rolls all of these dimensions into an overall benefits rating: a single score that tells you how your package stacks up against peers overall. This is useful for quickly communicating your position (and identifying where to improve) before your next renewal.
The Data Quality Problem: Why Most Comparisons Fall Short
The quality of your benchmark is only as good as the data behind it. A report based on 500 companies nationally tells you very little about what employers in your industry and region are doing. Generic averages can actually mislead, making you think you’re in better or worse shape than you actually are.
What you want is a benchmark built on a large, recent, and filterable data set. For context, a robust benchmarking tool draws from data across tens of thousands of employer locations, analyzes hundreds of thousands of actual plan documents, and offers custom cohort filtering so you can isolate peers that genuinely match your situation: same industry, same state, similar headcount.
The more granular the cohort, the more actionable the comparison. A 10-person restaurant in Nevada has very different benchmarks than a 10-person consulting firm in Nevada, even though both are small businesses in the same state. Industry-specific benchmarks are the only ones worth acting on.
How Small Businesses Can Access This Data
Historically, getting a quality benefits benchmark required hiring a benefits broker or HR consultant with access to commercial data platforms: services that typically come with significant fees or a sales process attached. That made them inaccessible to most small businesses.
That’s changing. AdvanStaff HR is offering a complimentary 25-page benefits benchmarking report to small business owners, at no cost and no obligation. The report draws from data on more than 75,000 employer locations and 200,000 medical plans analyzed in the last 12 months, with 10,000 custom cohorts available so your comparison is filtered to companies that actually look like yours.
The process is straightforward: fill out a short form, a Benefits Consultant reviews your details and reaches out if anything is missing, and the benchmark is run. Once the 25-page report is complete, a consultant walks you through it on a live call so you understand exactly what the data means for your business.
The report covers all six dimensions: medical plan design and employer contributions, dental and vision, leave and PTO policies, retirement benefits, and an overall benefits rating. You’ll leave with a clear picture of where you stand, and the data you need to make smart decisions at your next renewal.
When Is the Right Time to Benchmark?
The honest answer: before your next renewal, not during it. Once you’re in the middle of renewal negotiations, your options are constrained by timelines, carrier availability, and the internal bandwidth to manage a transition. That’s the wrong moment to discover your benefits are significantly below market.
Benchmarking 60 to 90 days before renewal gives you time to act on what you learn. If your medical plan contributions are below market, you can adjust the split before the new plan year. If you’re missing dental or a 401(k) match, you can add them with enough lead time to communicate the change to your team.
It’s also worth benchmarking if you’re experiencing higher-than-usual turnover, struggling to close candidates, or expanding into a new state or industry where different norms apply. Any of these signals suggest your current package may not be aligned with what the market expects.
Get Your Free Benefits Benchmarking Report
If you’re a small business owner who has been wondering whether your benefits package is where it needs to be, or if you’ve never actually compared your offerings to peers, this is the place to start.
The benchmarking report gives you the data to answer the question definitively. It’s built on the same type of analysis that large employers use, filtered to your exact situation, and reviewed with you by a specialist who can help you make sense of the numbers.
Request your free report here. It takes less than two minutes to submit your information, and there’s no cost or commitment involved.